Charts such as pie charts and graphs can add value to the presentation of an exported document. To insert a chart into your Word document and have chart values updated based upon mail merge fields, do the following:
- Insert a chart in Word: In Word, go to Insert - Chart and choose your desired chart.
- Make Sure that Image is In Line With Text: Right click with your cursor within the image, and choose Wrap Text - In Line With Text. If the image is not wrapped in line with text, this coding will not work.
- Display Chart Data: To view chart data, you can right-click with your cursor within the image, and choose Edit Data - Edit Data. This will open an Excel-like window where column A is the category name for each chart item, and column B contains chart values for each category.
- Create your Macro: For instructions on opening Visual Basic and creating a macro, click here.
- Set up your Macro: Use the following sample coding to update chart values using Visual Basic:
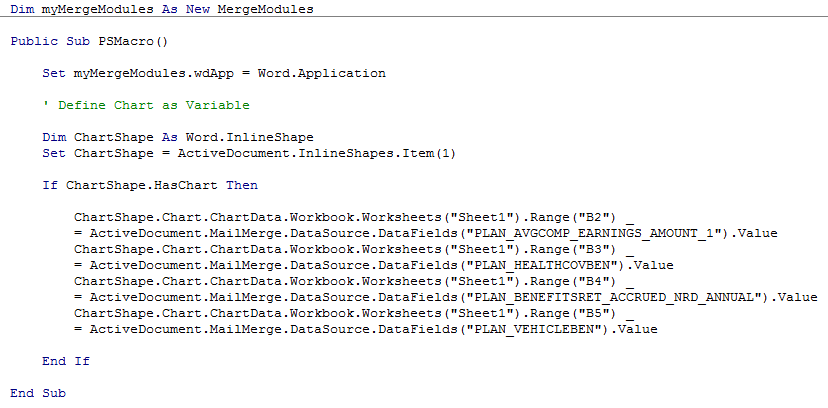
Note that in the example above, B2 corresponds to the first category's value, B3 is for the second category's value, etc. Also note that each data field (in quotations) is the corresponding merge field name.
